

Every store owner asks us the same question: “Is my conversion rate good?” The honest answer is — it depends on what you sell. A 1.5% conversion rate is a problem for a beauty brand but a solid result for a luxury jewelry store. That’s why comparing your store to a single “average” is one of the fastest ways to misdiagnose your business — and one of the most common mistakes we see when new clients come to us.
In this guide, we break down the 2026 ecommerce conversion rate benchmarks by industry, device, traffic source, and visitor type. We’ll also explain why these rates vary so widely, how to set a realistic target for your own store, and what we’ve learned helping brands close the gap through our ecommerce conversion rate optimization services.
What Is an Ecommerce Conversion Rate?
Your ecommerce conversion rate is the percentage of website sessions that end in a purchase. If 100 people visit your store and 3 buy something, your conversion rate is 3%. It’s the single clearest measure of how well your store turns traffic into revenue.
The formula: Completed purchases ÷ total sessions × 100 = conversion rate.
It’s worth distinguishing this from checkout completion rate, which only measures the final stage of the funnel — the percentage of shoppers who start checkout and actually finish it. The industry average checkout completion rate is roughly 47%, with top-performing stores exceeding 60%. Your overall conversion rate captures the entire journey; your checkout rate tells you whether the last step is where you’re bleeding sales. When we audit a store, we look at both, because they point to completely different problems.
The 2026 Global Average: 2.5%–3%
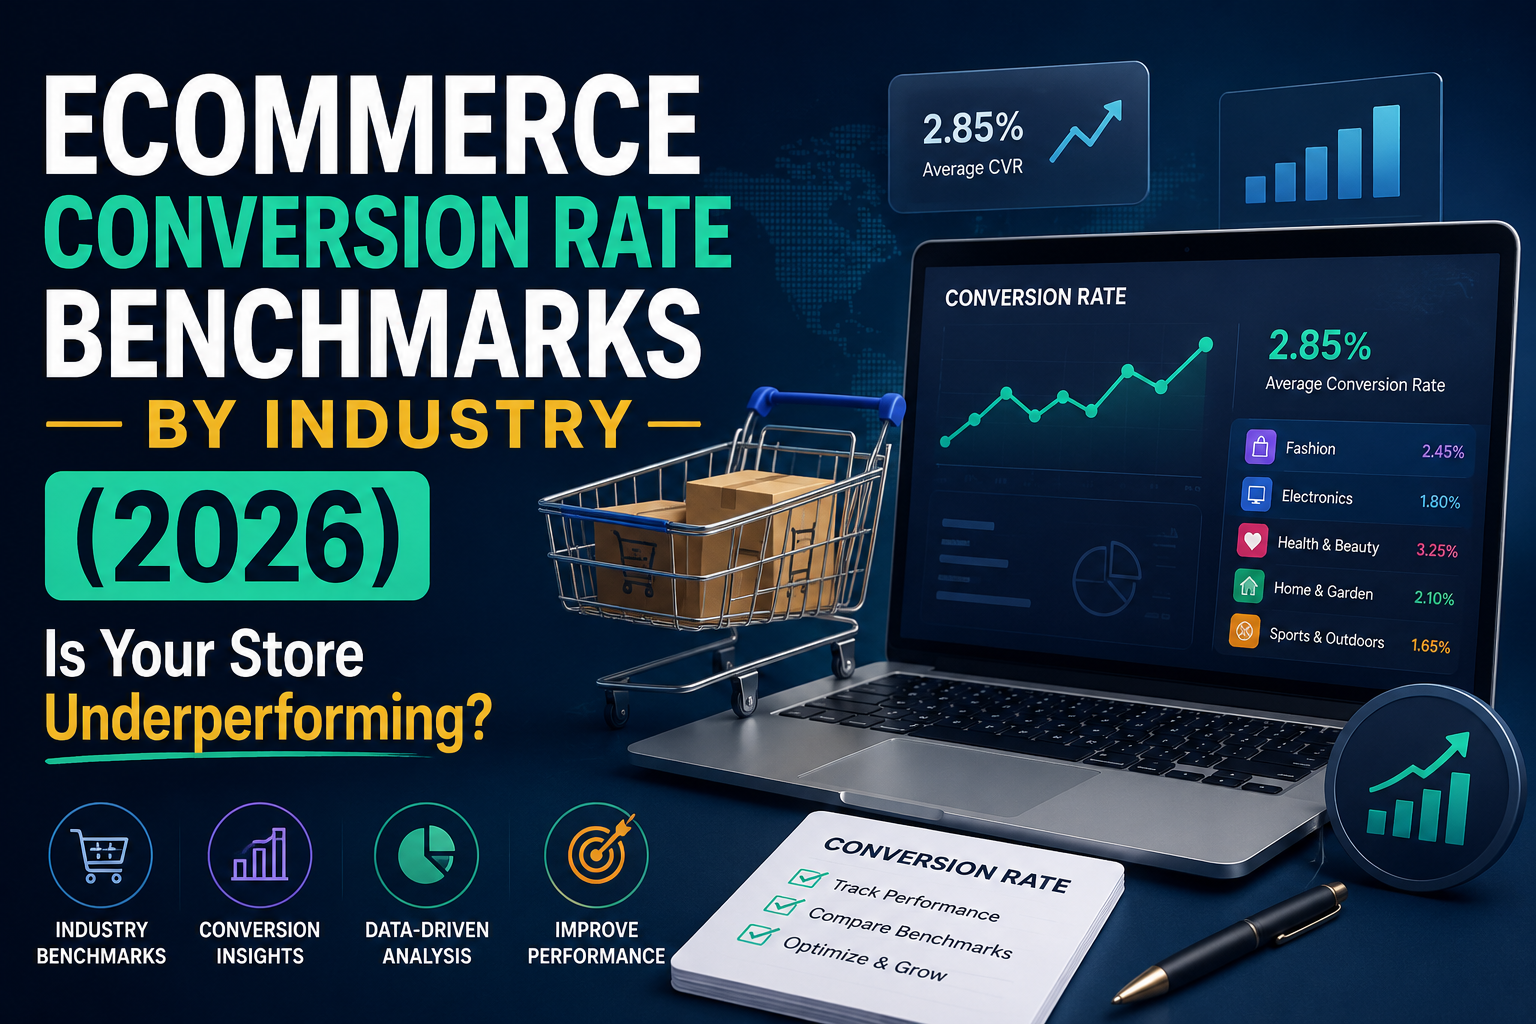
Across major industry datasets — including panels tracking hundreds of millions of sessions — the average ecommerce conversion rate in 2026 sits between 2.5% and 3%. Here’s the trend over recent years:
- 2020–2021: Pandemic-driven demand pushed averages up as shoppers flooded online
- 2022–2023: Rates dipped to roughly 2.4% amid economic uncertainty and rising ad costs
- 2024–2025: Recovery toward 2.7%, driven largely by AI-powered personalization and better mobile experiences
- 2026: Stabilizing in the 2.5%–3% range for established stores
Here’s how to read your own number against that range:
- Above 3%: You’re in the top tier. Your focus should shift to protecting that rate as you scale traffic.
- 2%–3%: Healthy, but there’s room. Targeted testing usually finds meaningful gains.
- 1%–2%: Real revenue is being left on the table — typically in checkout flow, mobile experience, or product page persuasion.
- Below 1%: Something structural is wrong. Either you’re attracting the wrong traffic entirely, or a serious trust, speed, or usability barrier is stopping ready buyers.
But the global average hides more than it reveals. The number that actually matters is your industry benchmark.
Ecommerce Conversion Rate Benchmarks by Industry (2026)
| Industry | Average Conversion Rate |
|---|---|
| Food & Beverage | 4.5% – 6% |
| Arts & Crafts | 4% – 5% |
| Beauty & Cosmetics | 3% – 4% |
| Pet Care & Supplies | 2.5% – 3.5% |
| Apparel & Fashion | 2% – 3% |
| Sporting Goods | 1.5% – 2.5% |
| Health & Wellness | 1% – 2% |
| Home & Furniture | 1.4% – 2% |
| Consumer Electronics | 0.5% – 1.5% |
| Luxury & Jewelry | 0.8% – 1.2% |
| Baby & Child Products | 0.5% – 1% |
The spread is enormous — food and beverage stores convert at roughly six times the rate of luxury retailers. Three factors drive most of the difference:
Average order value. A $12 snack requires almost no deliberation. A $2,000 sofa or a $5,000 watch involves research, comparison, and often multiple visits before purchase. Higher price points naturally mean lower session-level conversion — and that’s not a failure, it’s the shape of the category.
Purchase frequency. A customer buying their third bottle of a favorite serum converts almost instantly. A first-time visitor evaluating an unfamiliar brand does not. Categories with high repeat purchase rates — beauty, food, pet supplies — enjoy structurally higher conversion rates because a large share of their traffic is already sold.
Trust requirements. The more expensive, personal, or long-lasting the product, the more convincing your store has to do. Electronics and furniture buyers scrutinize reviews, return policies, warranties, and shipping terms in a way that snack buyers never will.
The takeaway: benchmark against your own industry, not the internet at large. As an ecommerce conversion rate optimization agency, the first thing we do with any new client is establish the right baseline — segmented by category, device, and traffic mix — before touching a single page. A store that looks “below average” globally is often performing fine for its vertical, and a store that looks “average” is sometimes badly underperforming its category.
Benchmarks by Traffic Source
Where your visitors come from matters as much as what you sell:
| Traffic Source | Average Conversion Rate |
|---|---|
| 4% – 5%+ | |
| Organic search | 2.7% – 3% |
| Direct traffic | 2% – 3% |
| Referral | 1.5% – 2.5% |
| Paid search | 1.5% – 2.5% |
| Paid social | 0.5% – 1.5% |
Two things stand out here. First, email is the highest-converting channel by a wide margin — these are people who already know you, which is why abandoned cart sequences and post-purchase flows are usually the fastest CRO wins available. Second, paid social converts at a fraction of other channels, because it interrupts people who weren’t shopping. That’s not a reason to abandon it — it’s a reason to judge it on different metrics and different timelines.
This is also why traffic quality and conversion rate can’t be separated. If your ad campaigns are attracting the wrong audience, no amount of page testing will fix your numbers. As a digital advertising company as well as a CRO team, we look at both sides of the equation — the ads bringing people in and the pages converting them — because optimizing one without the other only solves half the problem. We’ve audited plenty of stores whose “conversion problem” turned out to be a targeting problem.
Benchmarks by Device
- Desktop: 3% – 4%
- Mobile: 1% – 2%
- Tablet: 2% – 3%
Mobile drives the majority of traffic for most stores but converts at roughly half the desktop rate. Part of that gap is behavioral — people browse on their phones and buy on their laptops. But a large part of it is fixable: slow mobile load times, forms that are painful to fill out on a small screen, and checkout flows that were clearly designed on desktop first.
Here’s a quick diagnostic we use: if your mobile conversion rate is less than half your desktop rate, your mobile experience is almost certainly the culprit — and fixing it is usually the highest-ROI improvement available, because it lifts the majority of your traffic at once.
Benchmarks by Visitor Type
- Returning customers: convert at 2–3x the rate of new visitors
- New visitors: typically convert below 1.5% in most categories
This gap explains why customer retention is a conversion strategy, not just a loyalty strategy. Every returning customer raises your blended conversion rate. Stores that invest in email flows, loyalty programs, and post-purchase experience don’t just earn repeat revenue — they permanently improve their conversion economics. It’s also why a young store comparing itself to an established brand’s conversion rate is comparing apples to oranges: the established brand’s traffic is full of people who already trust it.
What About B2B Ecommerce?
B2B stores play a different game entirely. Conversion often means a quote request, an account signup, or a bulk order — not a one-click checkout — and buying cycles stretch across weeks, multiple stakeholders, and procurement processes. Raw conversion rates typically run lower than B2C, often in the 1%–2% range even for healthy stores, but each conversion is worth dramatically more.
That’s why we approach B2B stores as both a b2b channel marketing agency and a lead generation digital marketing company: the goal isn’t just more checkouts, it’s more qualified pipeline. For B2B clients, we optimize for the conversions that actually predict revenue — quote requests, demo bookings, account creation, and reorders — and we build the store experience around how business buyers actually purchase: custom pricing, account-based access, and bulk ordering. Measuring a B2B store against B2C retail benchmarks tells you nothing useful.
How We Help Stores Beat Their Benchmark
Knowing your benchmark is step one. Closing the gap is where the work happens. Our ecommerce conversion rate optimization services follow a consistent process:
1. Audit the full funnel. We find exactly where visitors drop off — landing page, product page, cart, or checkout — segmented by device and traffic source. Most stores are surprised to learn their “conversion problem” is concentrated in one or two specific stages, not spread evenly across the site.
2. Fix the friction first. Before any creative testing, we eliminate the known killers: slow page loads, surprise shipping costs revealed at checkout, forced account creation, missing trust signals, and mobile checkout flows that fight the user. These fixes alone often produce double-digit improvements.
3. Strengthen the persuasion layer. Once the mechanics work, we test the things that make people want to buy — product photography, review placement, urgency and guarantee messaging, bundle offers, and page layouts that answer objections before they’re raised.
4. Test, don’t guess. Every change is measured against real data with proper statistical significance, so improvements compound instead of canceling each other out. Opinions are cheap; test results aren’t.
5. Keep it running. Conversion rates drift as your catalog, traffic mix, and competitors change. Through our ecommerce store management services, we monitor performance continuously and catch declines early — because a store that converted at 3% last year can quietly slide to 2% while nobody’s watching, and that’s a 33% revenue loss hiding in plain sight.
The Revenue Math That Makes CRO Worth It
Here’s why we tell clients CRO is usually a better first investment than more ad spend. Say your store gets 20,000 sessions a month with a $90 average order value:
- At 2.0%: 400 orders = $36,000/month
- At 2.5%: 500 orders = $45,000/month
- At 3.0%: 600 orders = $54,000/month
Moving from 2% to 2.5% — a completely realistic improvement — adds $108,000 a year from the exact same traffic, with no additional ad spend. And unlike paid traffic, conversion improvements keep paying every month after the work is done. Pouring more budget into a leaky funnel just wastes money faster; fixing the funnel makes every future marketing dollar work harder.
Frequently Asked Questions
What is a good ecommerce conversion rate in 2026?
For most stores, 2.5%–3% is average and anything above 3% is strong. But the right target depends on your industry — a food brand should aim for 4%+, while a luxury retailer at 1.2% is already beating its category average. Always benchmark within your vertical.
Why is my conversion rate low even though I get a lot of traffic?
High traffic with low conversions usually means one of two things: you’re attracting the wrong visitors (a traffic quality problem), or something on your site is stopping the right visitors from buying (a trust, speed, or checkout problem). The fix is completely different depending on which one it is, which is why a proper audit comes before any changes.
How do I calculate my ecommerce conversion rate?
Divide the number of completed purchases by total sessions, then multiply by 100. Example: 450 orders ÷ 15,000 sessions × 100 = a 3% conversion rate. For a more accurate picture, calculate it separately for mobile vs. desktop and for each major traffic source.
Why do conversion rates vary so much by industry?
Three main reasons: price point (cheaper products involve less deliberation), purchase frequency (repeat buyers convert far faster than first-timers), and trust requirements (expensive or personal products demand more convincing). A food store and a jewelry store can both be performing well at wildly different rates.
How much can conversion rate optimization actually improve sales?
Even small gains compound dramatically. Moving from 2% to 2.5% is a 25% revenue increase from the exact same traffic — no additional ad spend required. That’s why CRO is often the highest-ROI investment an established store can make.
Should I focus on getting more traffic or converting the traffic I have?
If your conversion rate is below your industry benchmark, fix conversions first. More ad budget flowing into a leaky funnel just wastes money faster. Once your store converts at or above benchmark, scaling traffic becomes far more profitable — every visitor is worth more.
What’s a good mobile conversion rate?
Mobile typically converts at 1%–2%, about half the desktop rate. The more useful check is the ratio: if your mobile rate is less than half your desktop rate, your mobile experience — usually page speed or checkout flow — needs attention.
How long does conversion rate optimization take to show results?
Most stores see measurable improvement within 60–90 days. Quick wins like checkout fixes and page speed improvements often show impact within weeks, while A/B testing programs need enough traffic to reach statistical significance, so timelines vary with store size.
Do B2B ecommerce stores follow the same benchmarks?
No. B2B conversion rates run lower — often 1%–2% — because purchases involve larger orders, longer decision cycles, and multiple stakeholders. B2B stores should track quote requests, account signups, and reorder rates alongside raw conversion rate.
Find Out Where Your Store Stands
If you’re not sure how your store compares to these benchmarks — or you know you’re below them — we can help. Contact Centaur Strategies for a conversion audit, and we’ll show you exactly where your store is losing revenue, which fixes matter most, and what a realistic target looks like for your industry.
